Every great
idea begins with
a spark.
High-voltage ideas that stand out and move you forward.
Work
Loading...
Our Partners
View
All
Work
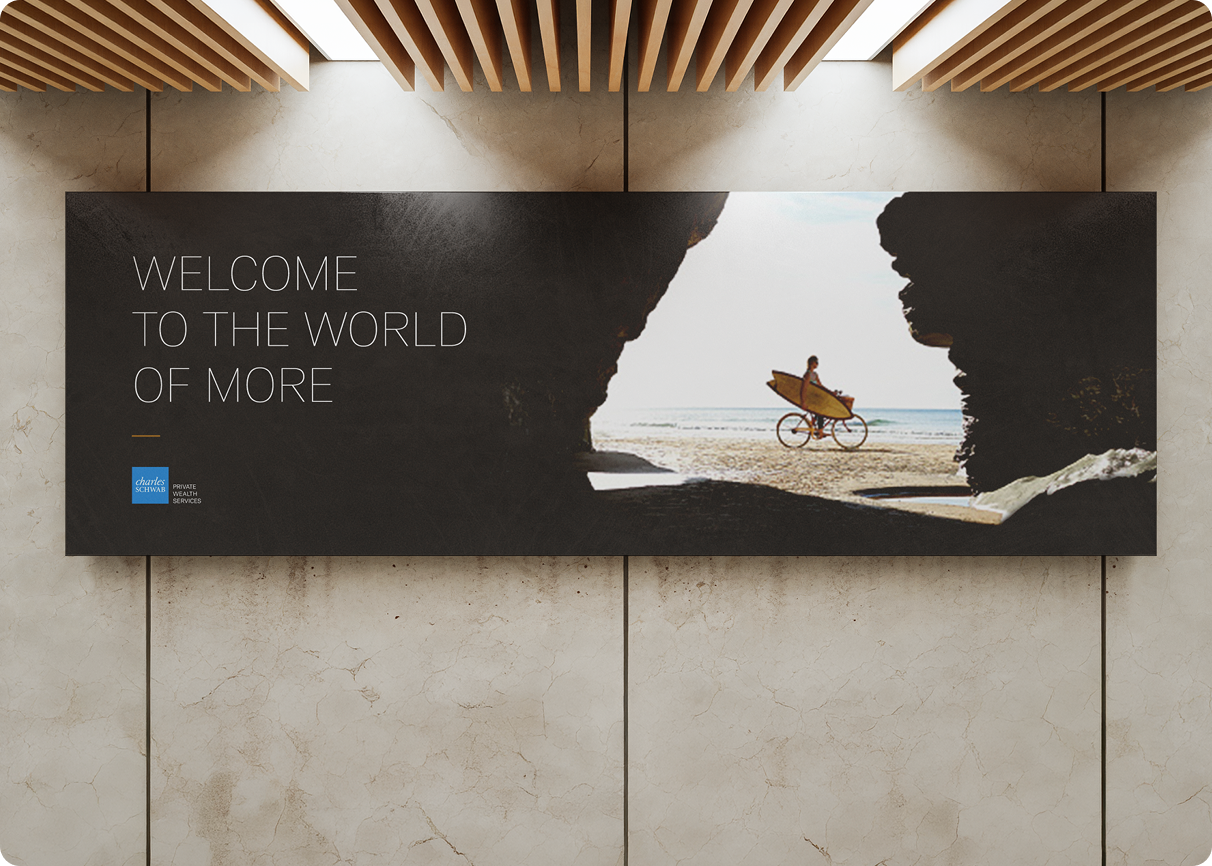
Affluent Visual Identity
Charles Schwab
Strategy
Content
Branding
“Why Schwab?” Campaign
Schwab Advisor Services
Content
Branding
"Beyond the Numbers" Campaign
Schwab Advisor Services
Web Design
Horizon Bank Website Redesign
Content
Web Design
Development
Marcus & Millichap Careers Hub
Branding
Web Design
Development
Yoakum National Bank Rebrand
Content
Branding
Web Design
Development
Tutorial Hub
Intuit Quickbooks
Web Design
Small Business Center
Intuit Quickbooks
Content
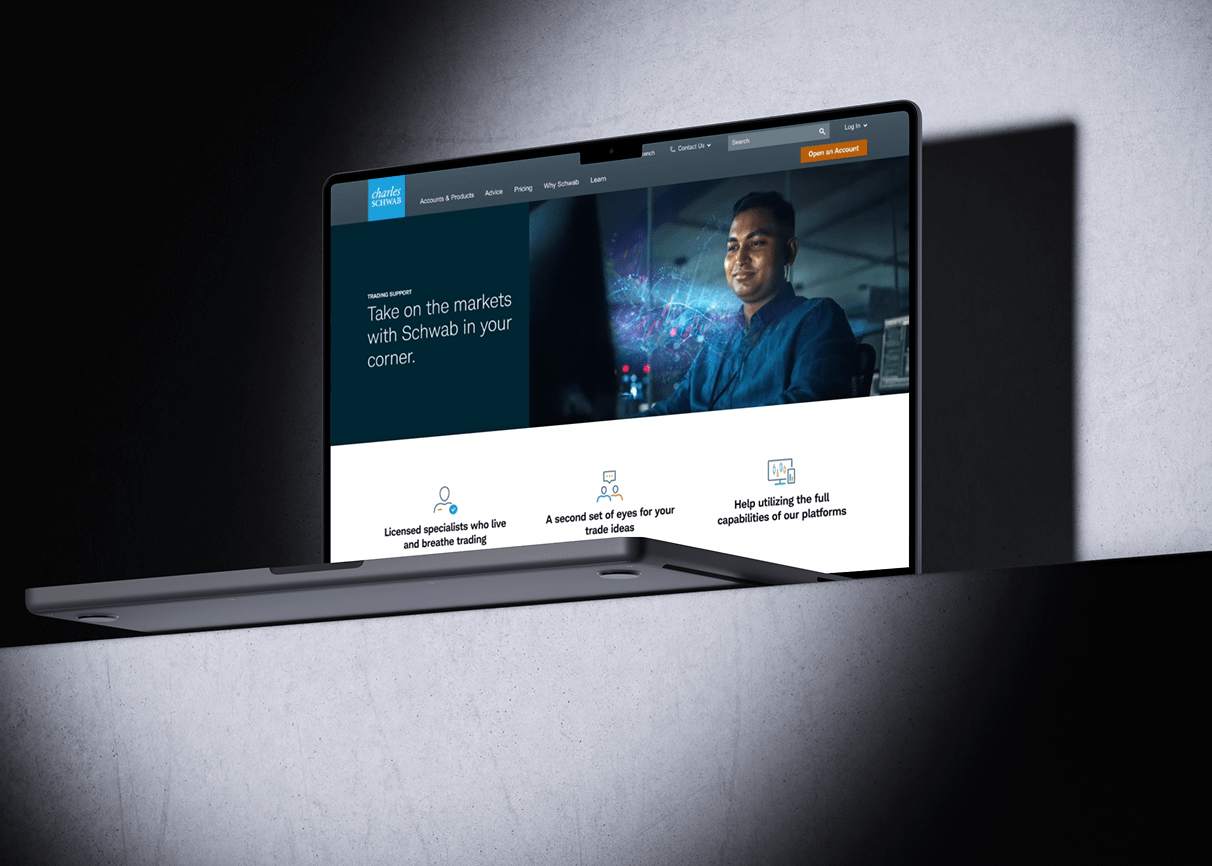
Schwab Trading Powered by Ameritrade™
Charles Schwab
Content
Web Design
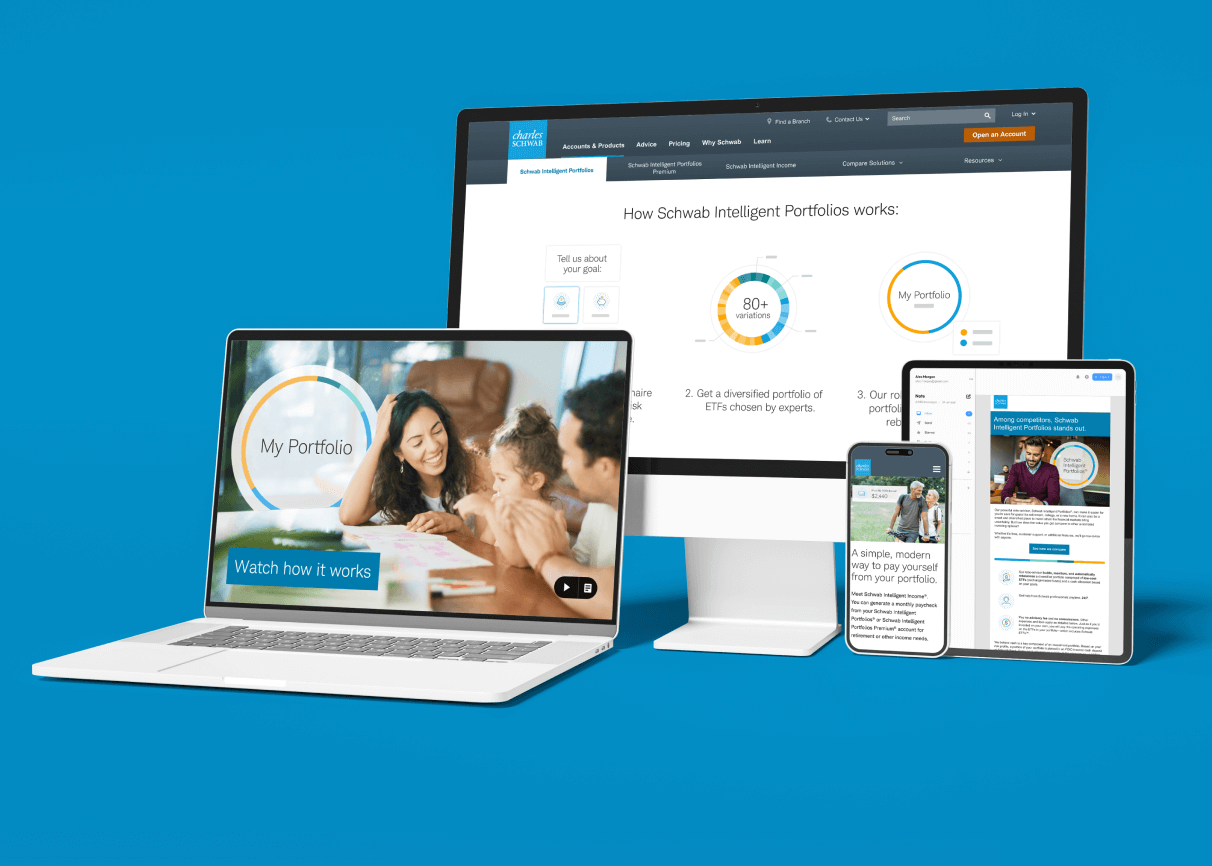
Schwab Intelligent Portfolios
®
Charles Schwab
Branding
Web Design
✕
All
strategy
content
branding
financial
video
interactive
dev